
The ICC men’s T20 World Cup is being played in the United Arab Emirates (UAE) and Oman. While the T20 tournament is a carnival on its own, the biggest clash of all – India vs Pakistan – is all set to light up Dubai on October 24. Like every T20 World Cup, there are certain favourites to lift the elusive title, owing to their past T20 records. However, having good T20I records doesn’t always assure you of the title.
India and Pakistan will start their world cup campaign as the teams with the most number of victories since the previous tournament in 2016. This strongly hints at either of the teams lifting the title. But history isn’t kind as most often than not form between World Cups does not always turn into a World Cup-winning performance.
In the 2012 edition, South Africa were hot favourites as they had 11 wins in 16 matches in the period since the previous World Cup, however, they crashed out in the Super 8 stage. The West Indies, who won the title, had the second-worst win-loss ratio among the top eight sides between 2010 and 2012.
According to ESPN Crcinfo, when it comes to win-loss ratios since last T20 WC, Afghanistan tops the list with 4.8 and West Indies are at the bottom of the list at 0.7.
Top 8 teams’ win-loss ratio since last T20 world cup:
Afghanistan 4.8
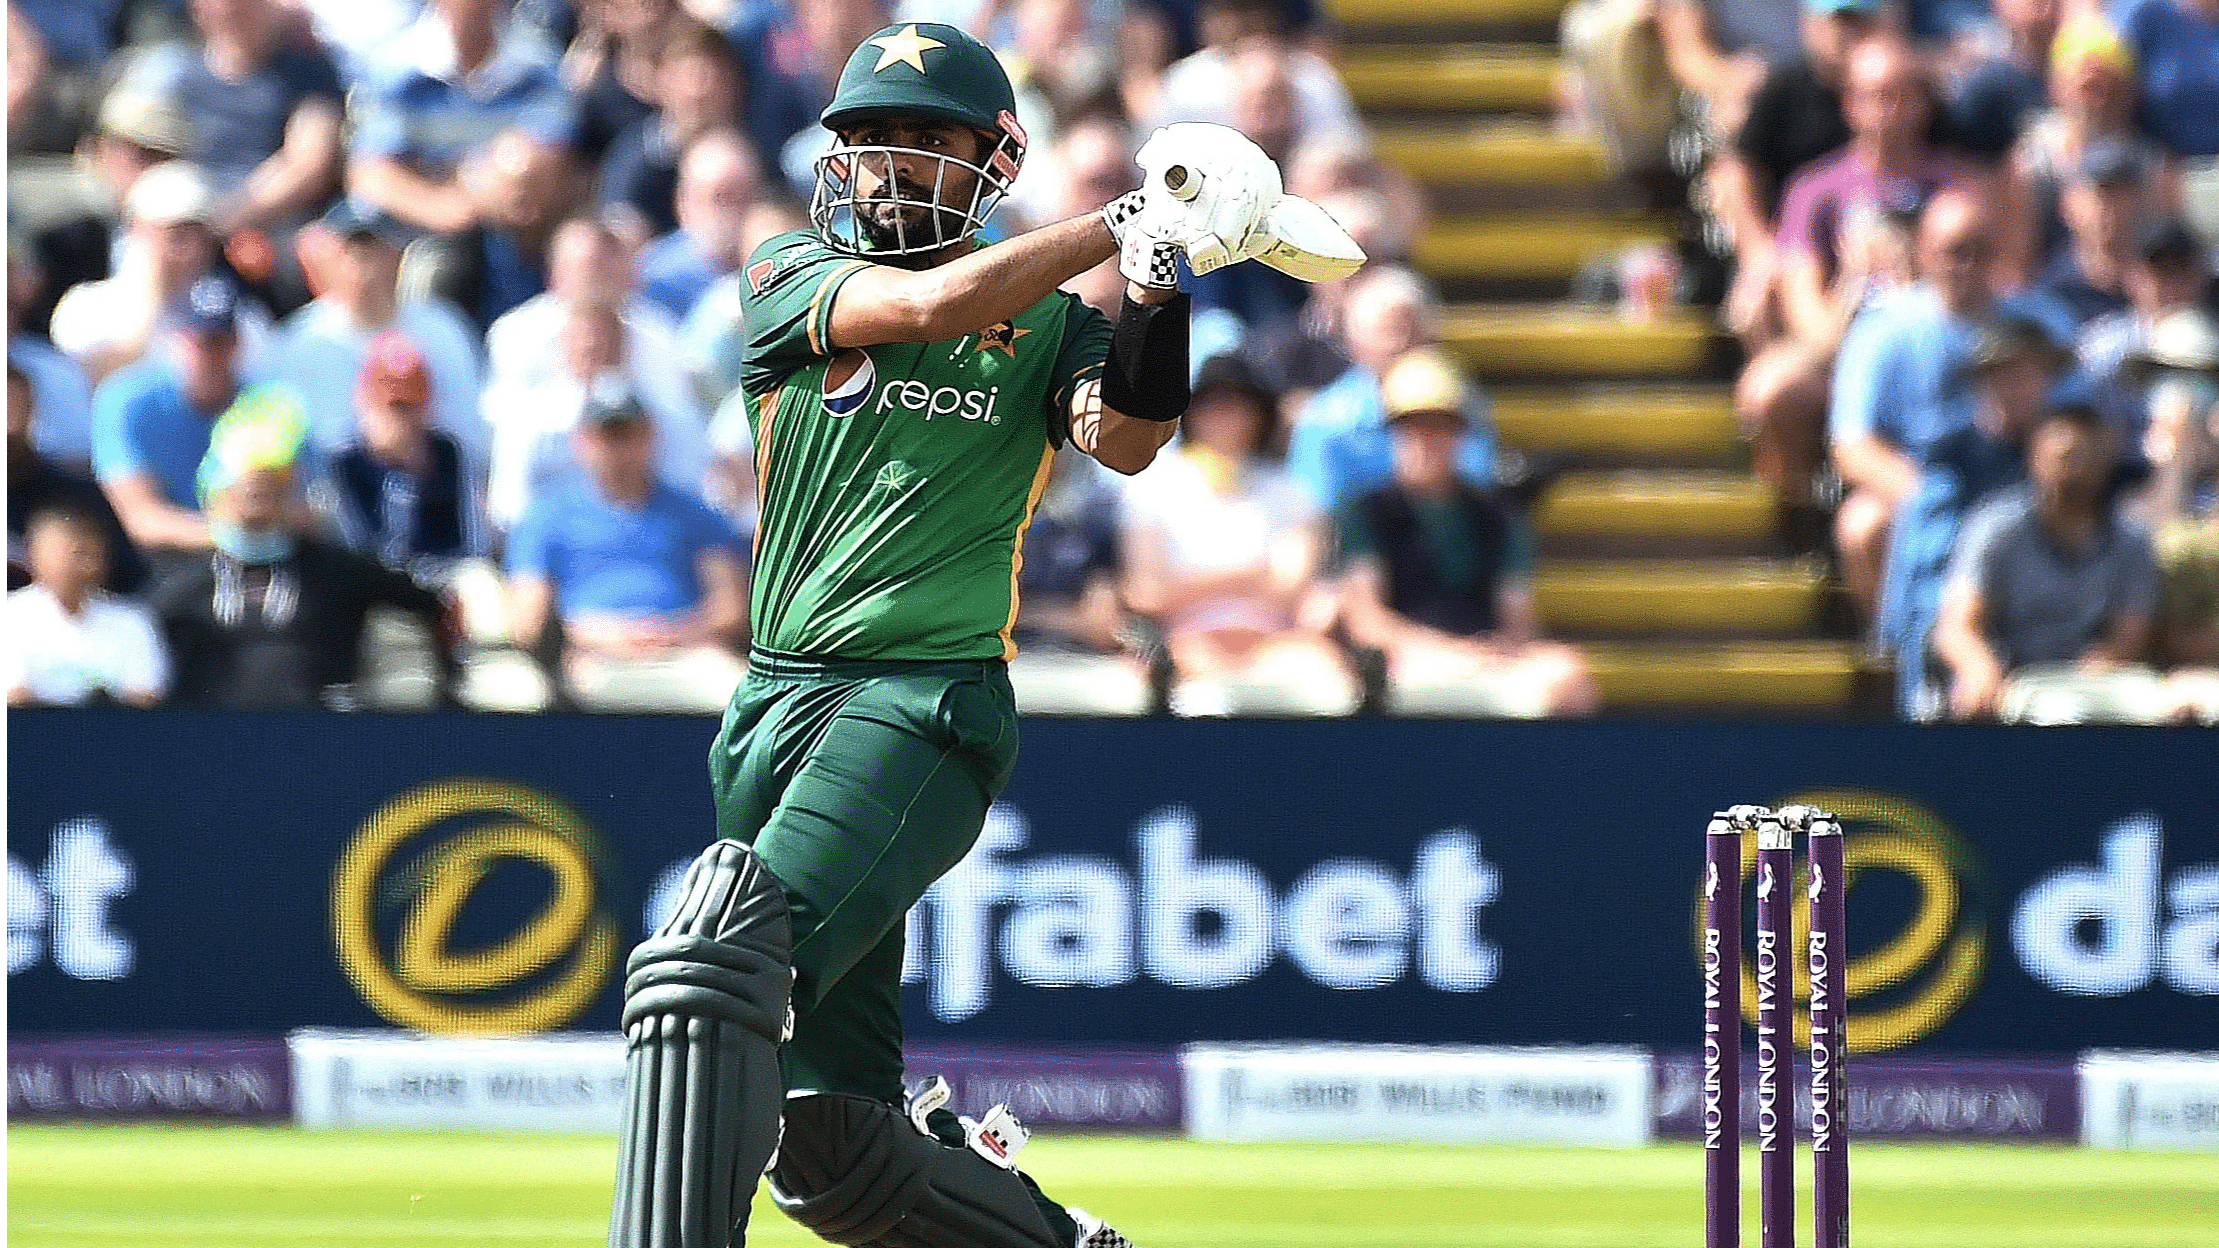
Pakistan 2.3
India 2
England 1.5
South Africa 1.2
New Zealand 1.1
Australia 1.1
West Indies 0.7
*figures current to october 19, 2021 (Cricinfo stats)
West Indies, in the semi-finals, defeated India with the best record between 2014 and 2016.
However, the 2014 editino saw Sri Lanka win the title. This time, the team in form won the title as they sported the best win-loss ratio in T20Is since the previous event.
This begs the question, how much does form matter? In the 2012 edition, South Africa had the best win/loss ratio of 2.75 but they crashed out in the Super 8 stage, the West Indies, on the other hand, with 0.71 were the eventual winners. In the 2014 edition, Sri Lanka had the best win/loss ratio of 2.66 and they were the eventual winners.
The 2016 edition saw India enter the competition with the best win/loss ration between two T20 WC editions but could only managed to reach the semis, the West Indies with 1.33 were the winners, again.
As per Cricinfo stats, here are the T20 record of the top sides-
Win-loss ratios since after the T20 world cup 2010
Afghanistan: 1.77 (T20 WC years)/ 3.16 (remaining period)
Australia: 0.88 (T20 WC years)/ 1 (rem period)
Bangladesh: 0.85 (T20 WC years)/ 0.5 (rem period)
India: 2.75 (T20 WC years)/1.69 (rem period)
NZ: 1.38 (T20 WC years)/ 1.14 (rem period)
Pakistan: 1.2 (T20 World Cup period)/1.81 (rem period)
South Africa: 1.12 (t20 wc years)/1.52 (rem period)
Sri Lanka: 0.64 (T20 WC years)/0.78 (rem period)
West Indies 1.55 (T20 WC years)/0.58 (rem period)
*T20 WC years = January 1 of relevant WC year to final of T20 WC that year (includes first quarter of 2020)


